RSS

Calgary Real Estate Market Update – February 2025: Shifting Towards Balance


In February 2025, Calgary's housing market experienced notable shifts, reflecting a transition toward more balanced conditions. While sales activity remained above historical averages, there was a discernible decline compared to the previous year, accompanied by significant growth in inventory levels.


Sales and Inventory

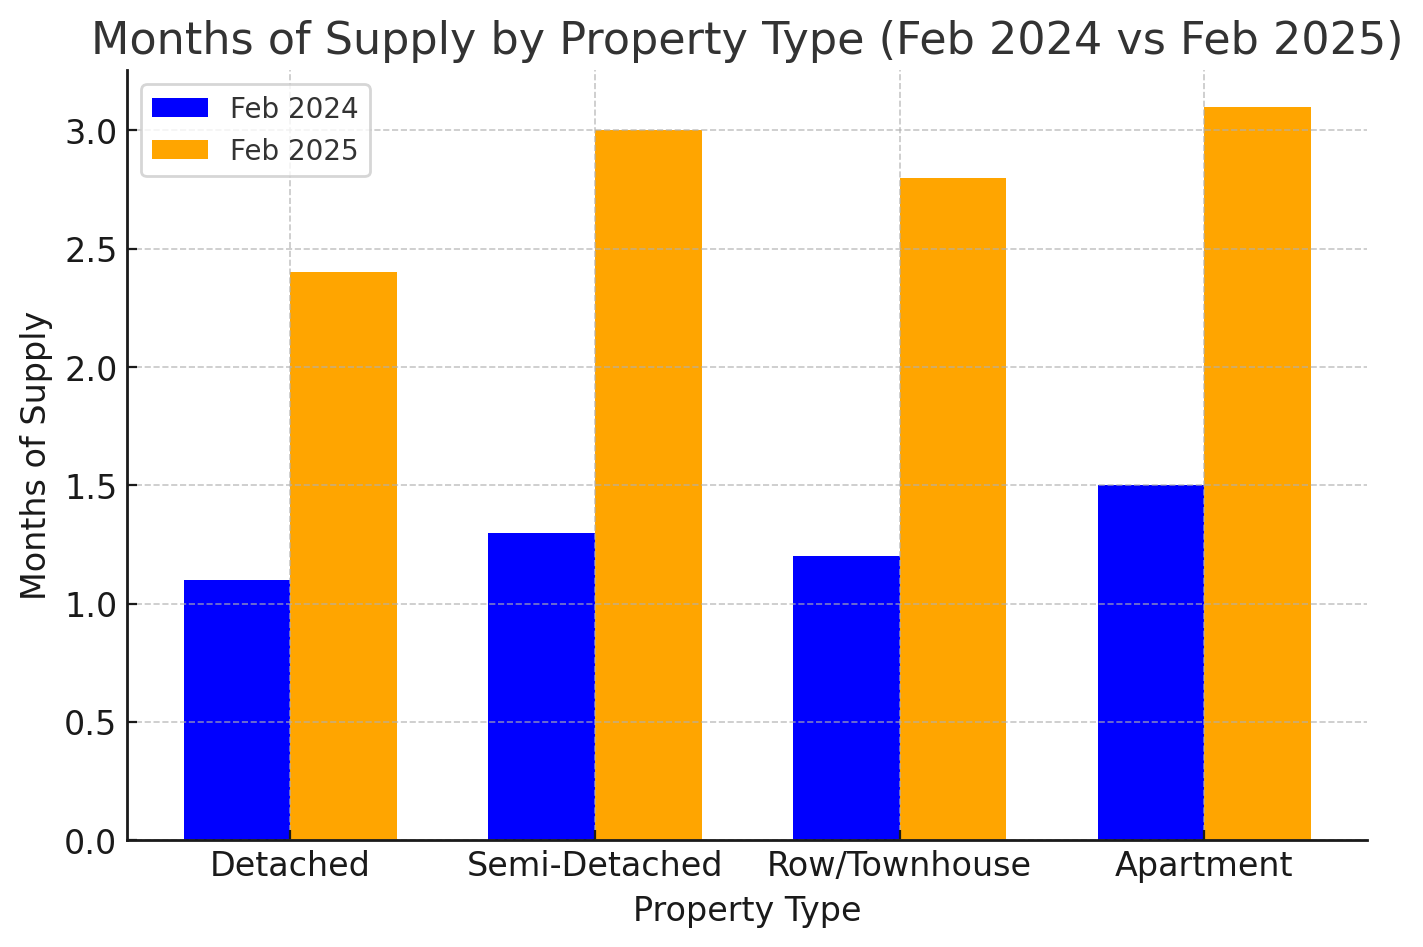
The city recorded 1,721 sales in February, marking a 19 per cent decrease from the same month last year. Despite this decline, sales figures remained higher than long-term trends for February. New listings increased by approximately six per cent year-over-year, reaching 2,830 units. This influx contributed to a substantial 76 per cent rise in inventory levels, totaling 4,145 units. Consequently, the months of supply—a measure of market balance—stood at 2.4 months, more than double the figure from February 2024. 

Alan Tennant, President and CEO of the Calgary Real Estate Board (CREB®), commented on these developments: "Even though more people listed their homes for sale, there were actually fewer sales than in February 2024. So, we’re seeing the seller’s market of the past two or three years ease off."


Benchmark Prices

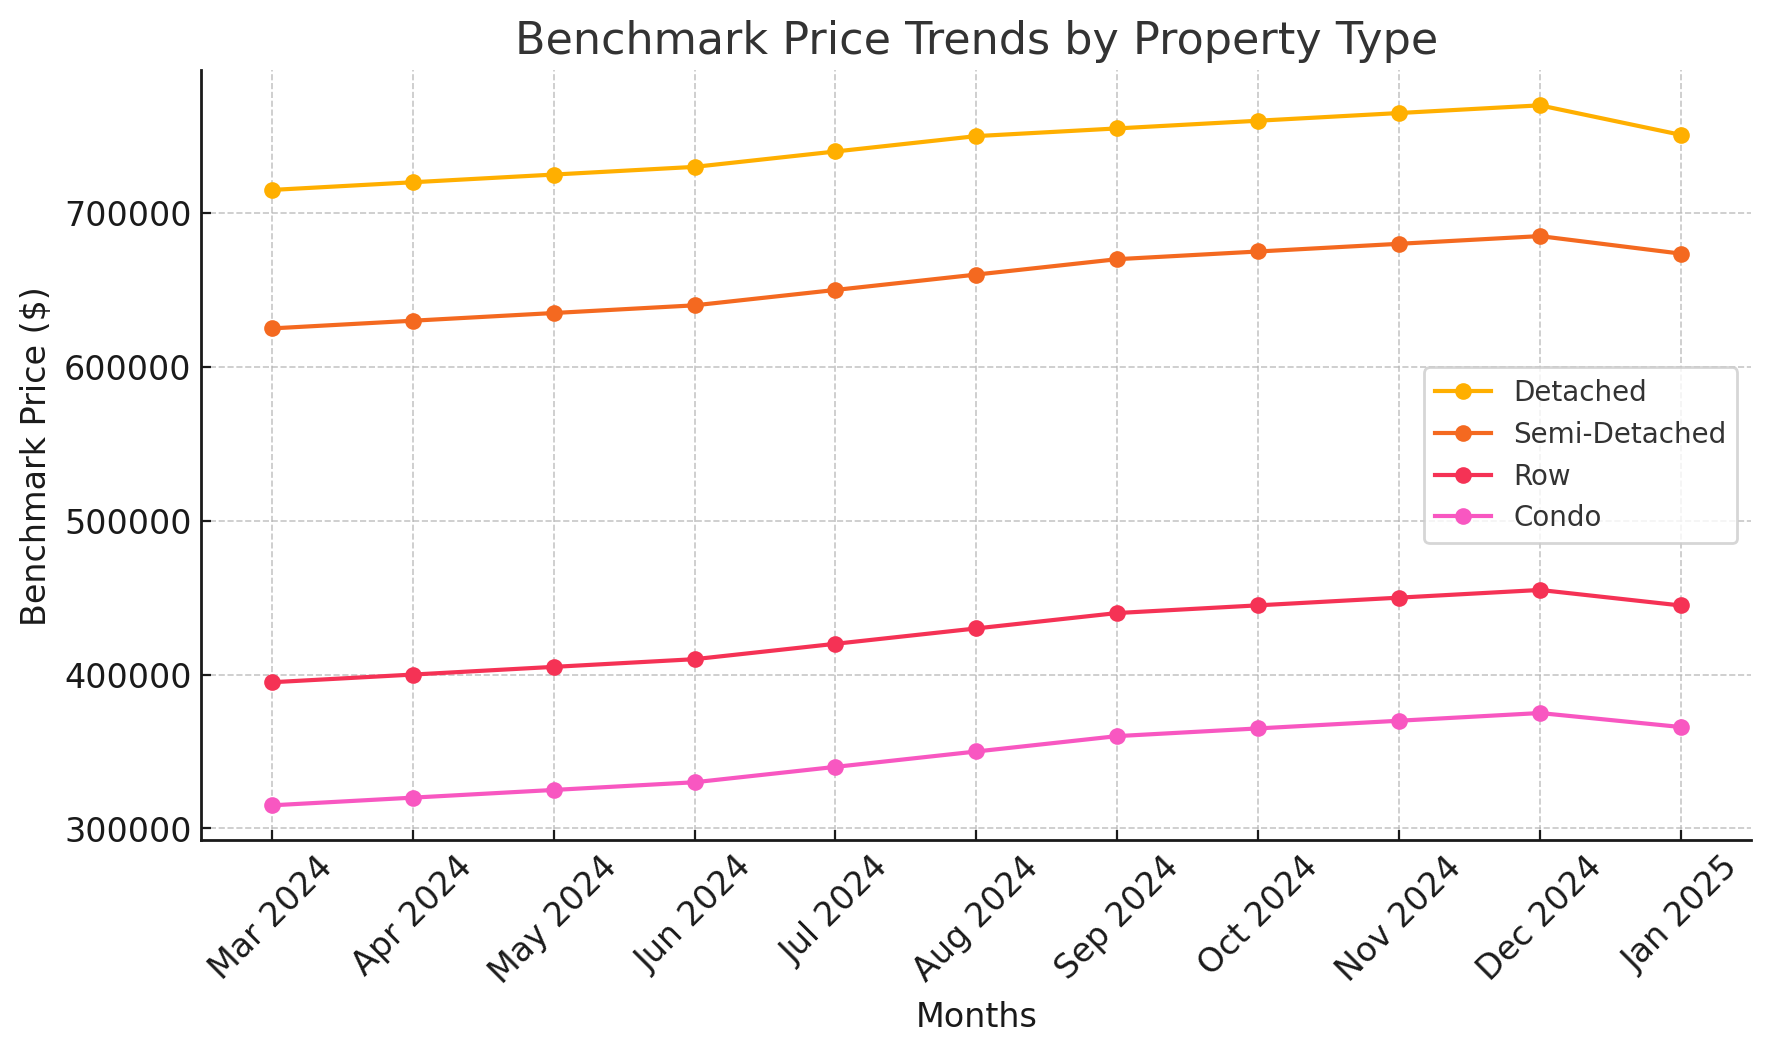
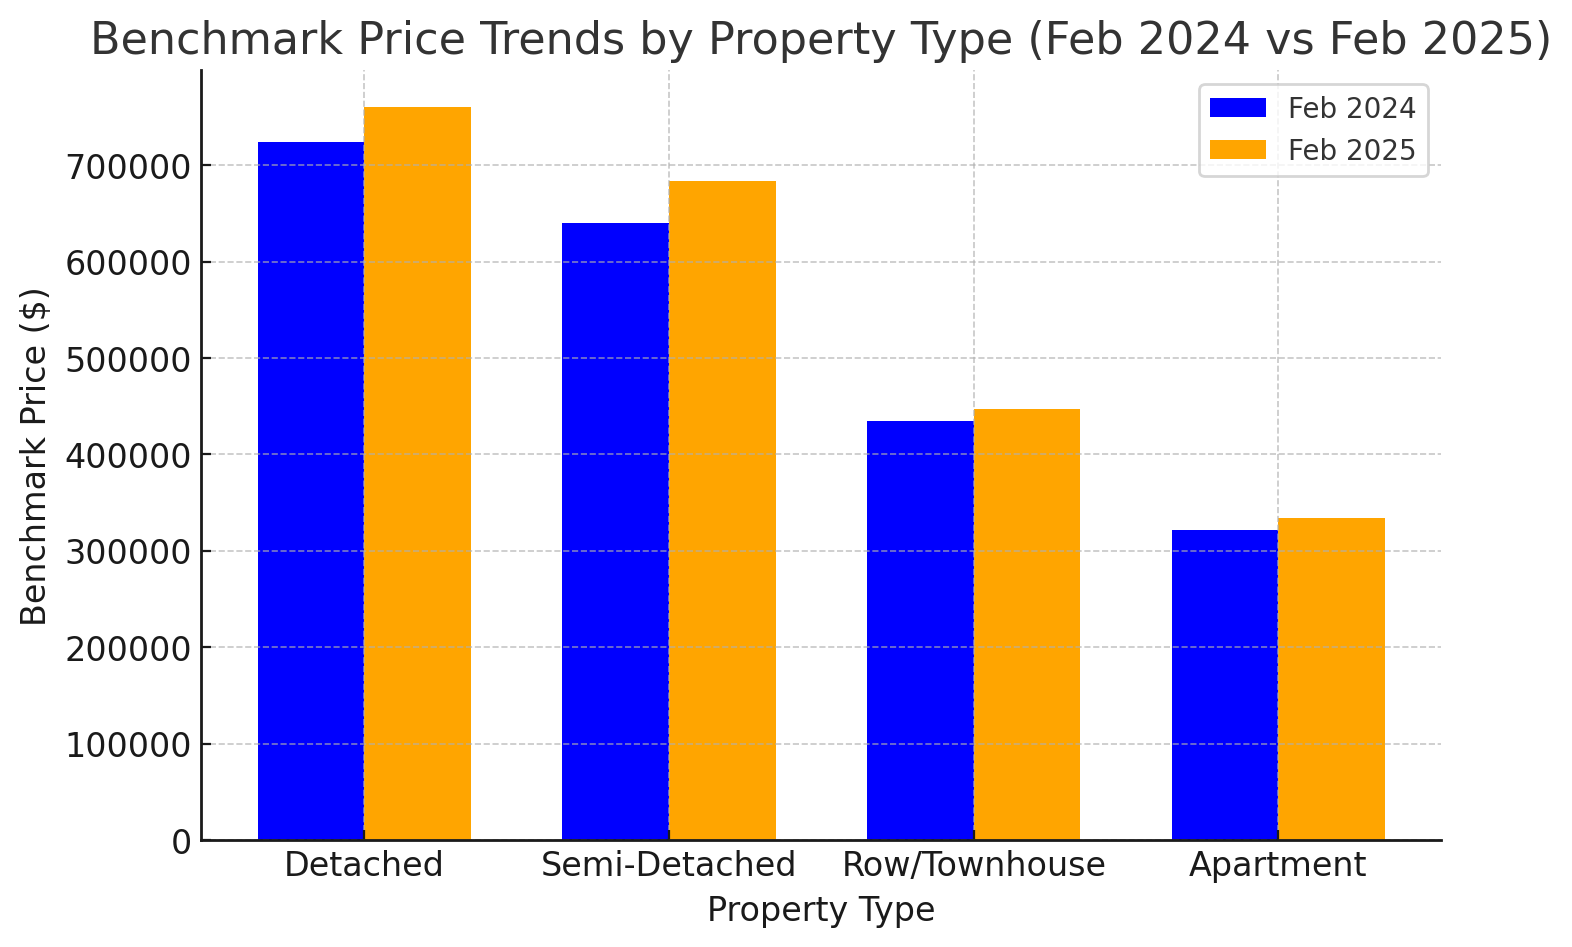
The unadjusted benchmark price for total residential properties in Calgary was $587,600 in February, reflecting a modest one per cent increase from the previous year. Price trends varied across different property types:

  • Detached Homes: The benchmark price rose to $760,500, a five per cent year-over-year increase. Notably, the City Centre district experienced the most significant growth, with prices climbing nearly eight per cent. 

  • Semi-Detached Homes: Prices reached $683,500, up nearly seven per cent from February 2024. The City Centre and South districts led this growth, each recording approximately eight per cent increases. 

  • Row/Townhouses: The benchmark price stood at $446,800, marking a three per cent rise year-over-year. The East district experienced a notable 12 per cent increase compared to 2024. 

  • Apartment Condominiums: Prices averaged $334,200, reflecting a four per cent increase from the previous year. The West district saw the largest price growth in this segment, exceeding eight per cent.


Market Dynamics by Property Type

  • Detached Homes: Sales decreased by 20 per cent year-over-year to 765 units. New listings grew by six per cent, resulting in a 61 per cent increase in inventory levels to 1,698 units. Months of supply improved across all districts, with the City Centre and North East trending toward balanced conditions, while the South and North West remained supply-constrained at approximately 1.6 months.

  • Semi-Detached Homes: Sales declined by nearly 14 per cent to 165 units, while new listings rose by seven per cent to 240 units. This disparity led to a 46 per cent increase in inventory. Months of supply varied significantly across the city, from one month in the North West to eight months in the East district. 

  • Row/Townhouses: Despite a nine per cent drop in sales to 318 units, new listings increased by almost four per cent. Inventory levels more than doubled to 655 units, though they remained below historical averages for February. The South and East districts had the tightest conditions, with under 1.5 months of supply, while the North East had nearly three months. 

  • Apartment Condominiums: Sales fell by 26 per cent to 473 units but remained above long-term averages for February. New listings were relatively stable year-over-year at 852 units, the highest on record for the month. This led to a 90 per cent increase in inventory, pushing months of supply to 3.1 months—still below record levels observed between the 2014 oil crash and the pandemic. 


Regional Market Highlights

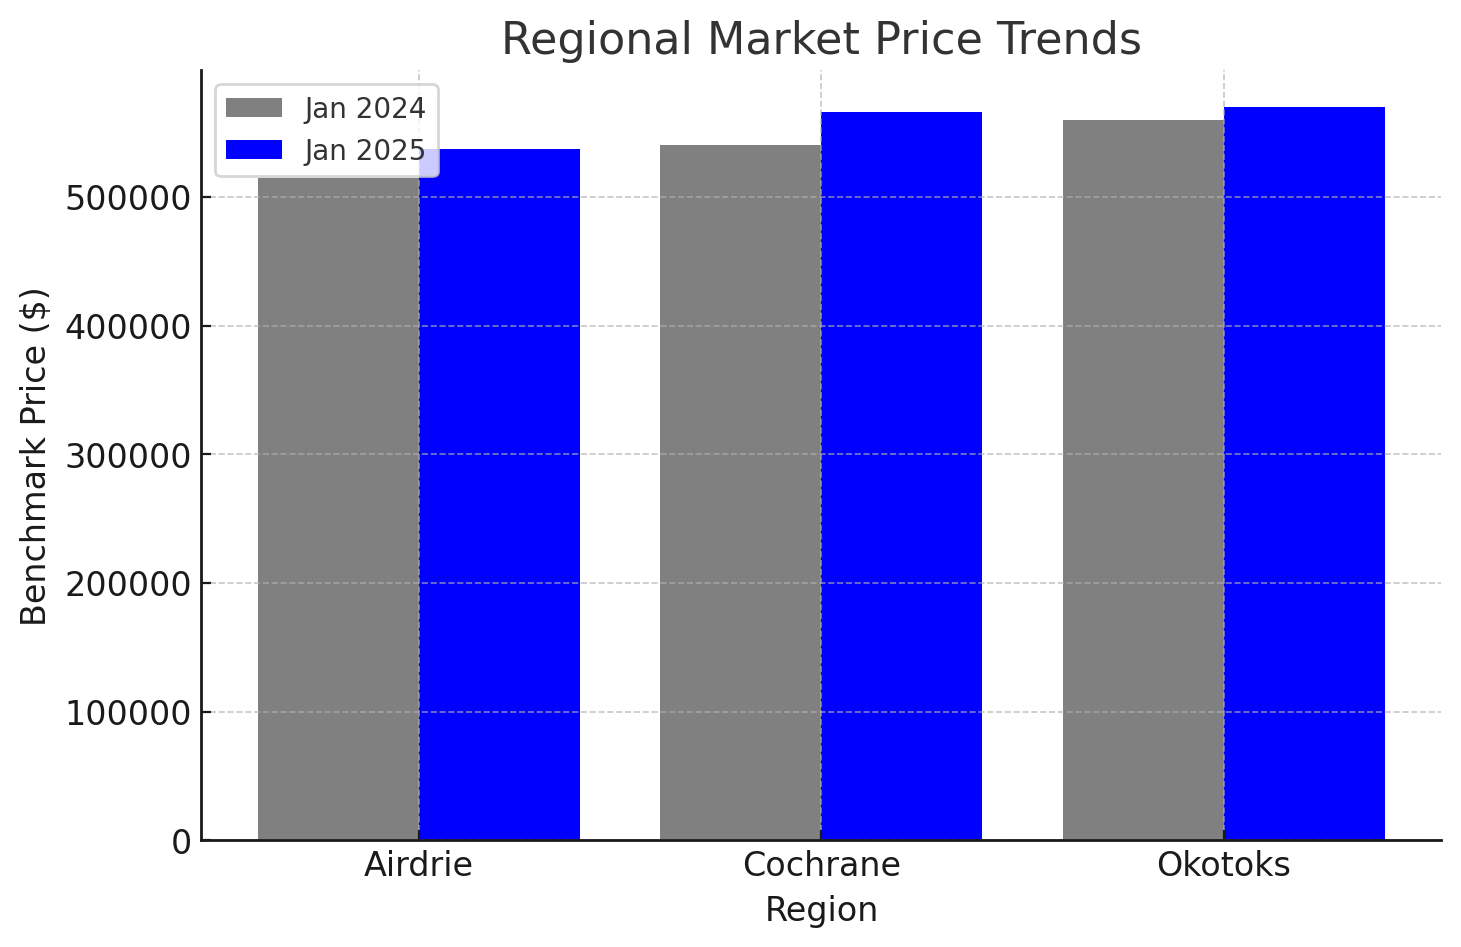
  • Airdrie: Sales declined by nearly nine per cent to 123 units. New listings increased by nearly 23 per cent to 225 units, doubling inventory levels to 345 homes. The benchmark price was $537,600, 1.6 per cent higher than in February 2024.

  • Cochrane: Sales reached 75 units, with new listings at 126 units, both above long-term averages. Inventory rose by over 48 per cent year-over-year to 196 units. The benchmark price increased by over five per cent to $577,100. 

  • Okotoks: Sales saw a four per cent year-over-year decline to 45 units. New listings increased by seven per cent compared to 2024, totaling 60 units. Inventory recovered to 69 units, 19 per cent above 2024. The benchmark price was relatively flat compared to January and under one per cent higher than in 2024. 


Final Thoughts: A Market in Transition

February 2025 marked a noticeable shift in Calgary’s housing market dynamics. While sales remained above long-term trends, the increase in inventory and moderation in price growth indicate a cooling from the intense seller’s market of previous years. Detached and semi-detached homes continue to see price appreciation, while row and apartment-style properties are experiencing a more gradual upward trend.

For buyers, the growing inventory and easing market conditions may present opportunities, especially in segments where months of supply are increasing. For sellers, strategic pricing and well-prepared listings will be key to standing out in a more balanced environment.

As Calgary’s real estate landscape continues to evolve, staying informed is crucial for making well-timed decisions. Whether you're buying, selling, or simply watching the market, working with an experienced real estate professional ensures you navigate these changes with confidence.


Source CREB.com

Read

Is Calgary’s Real Estate Market Cooling? January 2025 Market Trends Explained

In January 2025, Calgary's housing market experienced notable shifts, with increased inventory levels and a slight moderation in sales activity. According to the Calgary Real Estate Board (CREB), inventory levels rose to 3,639 units, marking a 70% year-over-year increase. Despite this significant gain, inventories remain below the typical January levels of over 4,000 units. The rise in supply was primarily driven by a boost in new listings, which reached 2,896 units in January compared to 1,451 sales. This influx of new listings contributed to a months of supply figure of 2.5 months, an improvement from the one month reported last year, yet still considered low for a winter month.

Sales activity in January saw a 12% decline compared to the same month last year, totaling 1,451 transactions. However, it's important to note that despite this decrease, sales levels remained nearly 30% higher than the typical figures recorded in January. The total residential benchmark price was reported at $583,000, which is relatively stable compared to the end of last year and nearly 3% higher than January 2024. Price growth varied across different districts and property types within the city.


Detached Homes

New listings for detached homes increased by 29% year-over-year, reaching 1,228 units in January. Sales activity in this segment slowed to 674 units, aligning with long-term trends. The improvement in new listings relative to sales supported inventory gains; however, the 1,448 units in inventory are still nearly 27% lower than typical January levels. The months of supply remained relatively low at just over two months. The unadjusted benchmark price for detached homes was $750,800, slightly higher than the previous month and 7% higher than January 2024.


Semi-Detached Homes

The semi-detached sector experienced gains in new listings relative to sales, leading to some increases in inventory levels. Sales in January improved over last year, keeping the months of supply just below two months. Notably, the City Centre, North East, and West districts reported near or above three months of supply, while other districts maintained less than two months. The unadjusted benchmark price was $673,600, slightly lower than the previous month but over 8% higher than January 2024. Districts with higher months of supply saw modest monthly price declines, while others experienced stable to modest gains.


Row Homes

In 2024, row home sales reached 4,647 units, a gain of over 2% compared to the previous year and the second-highest total on record. The growth in sales was facilitated by an 18% increase in new listings, particularly for homes priced above $400,000. This rise in new listings relative to sales supported inventory growth throughout 2024. By year-end, the improved supply helped alleviate some pressure on home prices. However, the annual benchmark price still rose by 14% as conditions favored sellers throughout the year. Price increases were observed across all city districts, ranging from 12% in the City Centre to over 20% in the North East and East districts.


Apartment Condominiums

January reported a boost in new listings compared to sales activity in the apartment condominium segment, causing inventory levels to rise to 589 units—more than double the near-record low levels reported last January. This increase brought inventories more in line with long-term trends. The months of supply also improved, pushing above two months, a trend that began in the second half of last year. While improving supply relative to sales has taken some pressure off home prices, this effect has not been consistent across the city. Citywide, the unadjusted benchmark price was $444,900, slightly lower than the previous month but nearly 5% higher than last year. The largest monthly adjustment occurred in the North East district.


Regional Markets

  • Airdrie: Sales in January remained consistent with levels reported in the previous month and last year, both well above long-term trends. A boost in new listings led to improved inventory levels, with the months of supply remaining above two months for the fifth consecutive month. The unadjusted benchmark price was $537,300, down from the previous month but nearly 4% higher than last year.


  • Cochrane: Improved levels of new listings and inventories were observed, with 104 new listings in January compared to 71 sales, pushing inventories up to 156 units. While inventory levels are better than the past three years, they still fall short of long-term trends for January. The unadjusted benchmark price was $565,900, down from the previous month but nearly 5% higher than last January.


  • Okotoks: New listings remained relatively low compared to last year. While a pullback in sales supported some improvements in inventory levels, the 68 units available in January are still half the levels available in January prior to the pandemic. Limited supply has driven much of the price gains in this market since 2021.


Overall, Calgary's housing market in January 2025 is showing signs of moving toward more balanced conditions, with increased inventory levels and moderated sales activity. While prices have remained relatively stable, variations exist across different property types and districts within the city.


Source creb.com

Read
Categories:   Acreage Buyer Tips | Acreage Living | Agency Relationship Guide | Airdrie Cochrane Okotoks | Alberta Home Buying Tips | Alberta Housing Market | Alberta Real Estate | Alberta Real Estate News | April 2025 Market Update | Balanced Market | Builder Homes | Builder Possession Deadlines | Business Mindset | Butchart Gardens | Buyer & Seller Strategy | Buyer & Seller Tips | Buyer Brokerage Agreement | Buyer Education | Buyer Expectations | Buyer Opportunities | Buyer Representation | Buyer Representation Agreement | Buyer Tips Calgary | Buyer's Agent | Buyer's Market | Buying a Home in Calgary | Buying Acreage | Buying and Selling | Buying from a Builder | Calgary Acreages | Calgary Home Prices | Calgary Housing Stats | Calgary Housing Trends | Calgary Inventory Report | Calgary Inventory Update | Calgary Market Trends | Calgary Real Estate | Calgary Real Estate Advice | Calgary Real Estate Market | Calgary Real Estate Stats | Calgary Real Estate Trends | Calgary REALTOR® | Canada Adventures | Cleaning Standards | Client Representation | Client vs Customer | Country Living | CREB Data | CREB Statistics | CREB Stats | Custom Homes | Elevated Mastermind | Exclusive Agreements | Fairmont Empress | February 2025 | Final Walkthrough | Financial Planning | First-Time Buyers | Home Affordability | Home Buyer Guide | Home Buying Tips | Home Closing Checklist | Home Prices Calgary | Home Sale Conditions | Homebuyer Education | Hotel Grand Pacific | Housing Inventory | Housing Market Insights | Inventory Levels | January 2025 | KIC Realty | Legacy, Calgary Real Estate | Luxury Real Estate | March 2025 Market Update | Market Shifts 2025 | Market Shifts Calgary Real Estate | Market Update | Market Updates | Mastermind | May 2025 Market Update | Mindful Travel | Monthly Market Insights | Monthly Market Report | Mortgage Budgeting | Mortgage Pre-Approval | Move-Up Buyers | New Build Homes | New Builds vs Resale | New Home Construction | Oak Bay Beach Hotel | Personal Growth | Personal Growth Journey | Possession Day Tips | Price Growth | Real Estate 101 | Real Estate Advice | Real Estate Agency | Real Estate Best Practices | Real Estate Commission | Real Estate Contracts | Real Estate Cooling Trends | Real Estate Costs | Real Estate Insights | Real Estate Investment Calgary | Real Estate Leadership | Real Estate Mastermind | Real Estate Possession | Real Estate Retreat | Real Estate Strategy | Real Estate Timing | Real Estate Trends Calgary | Realtor Life | REALTOR® Advice | REALTOR® Compensation | REALTOR® Fees | REALTOR® Retreat | REALTOR® Tips | Regional Market Reports | Regional Real Estate Trends | Rural Real Estate | Sales-to-Listings Ratio | Seller Representation | Seller Responsibilities | Seller Strategy Calgary | Selling a Home in Calgary | Selling to Buy | Septic and Well Systems | Solo Travel | Steamship Grill & Bar | Vancouver Island | Victoria BC Travel | Victoria Travel Guide | Vista 18 Victoria | Whale Watching | Women in Business | Women in Real Estate | Working with a Buyer's Agent | Working with a REALTOR® | YYC Homes | Zoning and Land Use
Data is supplied by Pillar 9™ MLS® System. Pillar 9™ is the owner of the copyright in its MLS®System. Data is deemed reliable but is not guaranteed accurate by Pillar 9™.
The trademarks MLS®, Multiple Listing Service® and the associated logos are owned by The Canadian Real Estate Association (CREA) and identify the quality of services provided by real estate professionals who are members of CREA. Used under license.