In February 2025, Calgary's housing market experienced notable shifts, reflecting a transition toward more balanced conditions. While sales activity remained above historical averages, there was a discernible decline compared to the previous year, accompanied by significant growth in inventory levels.
Sales and Inventory
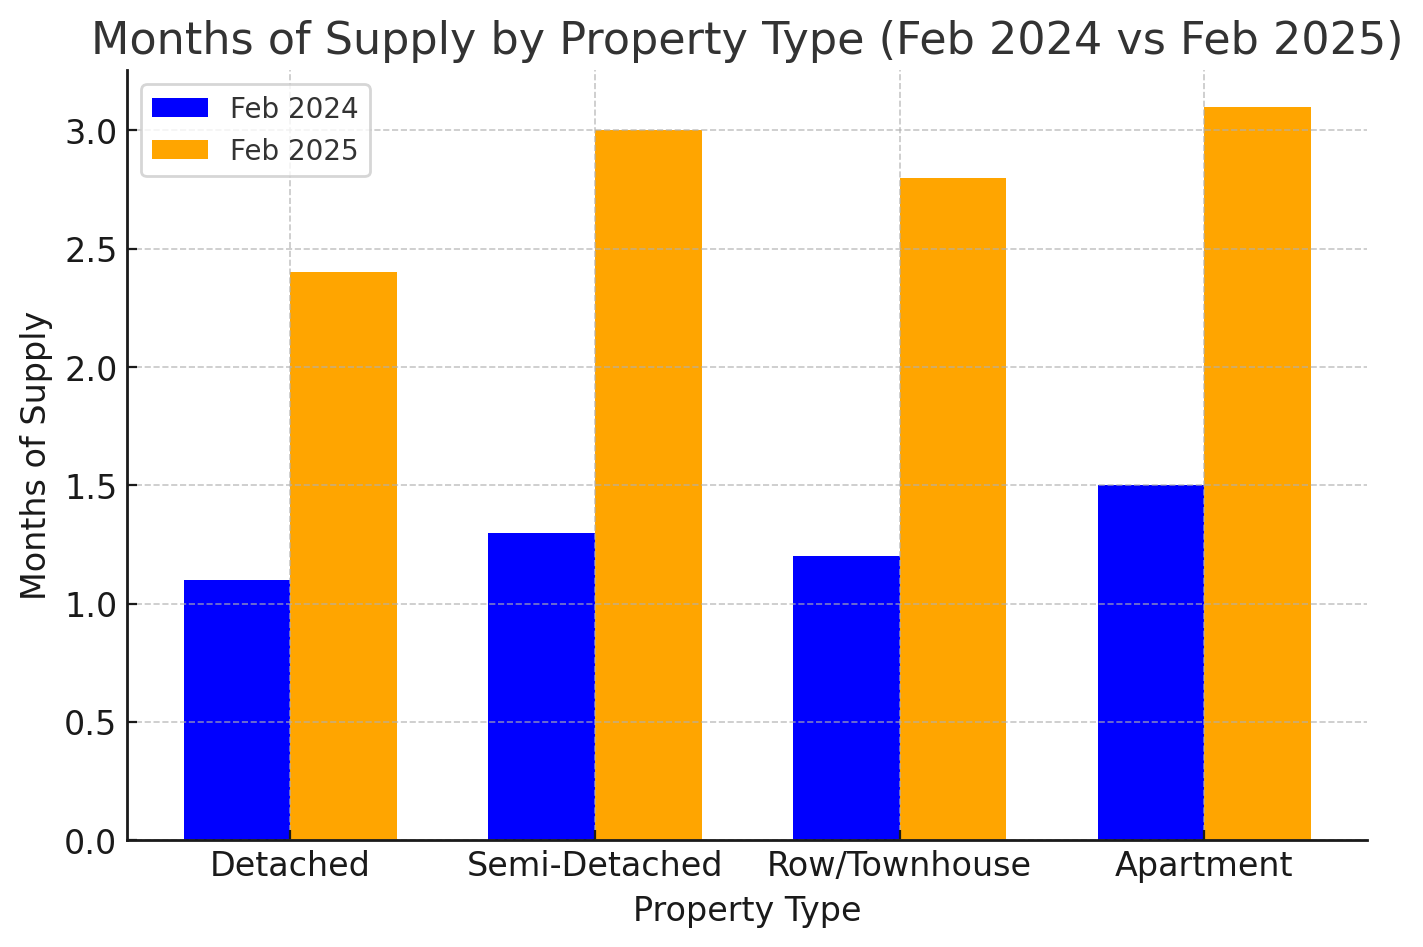
The city recorded 1,721 sales in February, marking a 19 per cent decrease from the same month last year. Despite this decline, sales figures remained higher than long-term trends for February. New listings increased by approximately six per cent year-over-year, reaching 2,830 units. This influx contributed to a substantial 76 per cent rise in inventory levels, totaling 4,145 units. Consequently, the months of supply—a measure of market balance—stood at 2.4 months, more than double the figure from February 2024.
Alan Tennant, President and CEO of the Calgary Real Estate Board (CREB®), commented on these developments: "Even though more people listed their homes for sale, there were actually fewer sales than in February 2024. So, we’re seeing the seller’s market of the past two or three years ease off."
Benchmark Prices
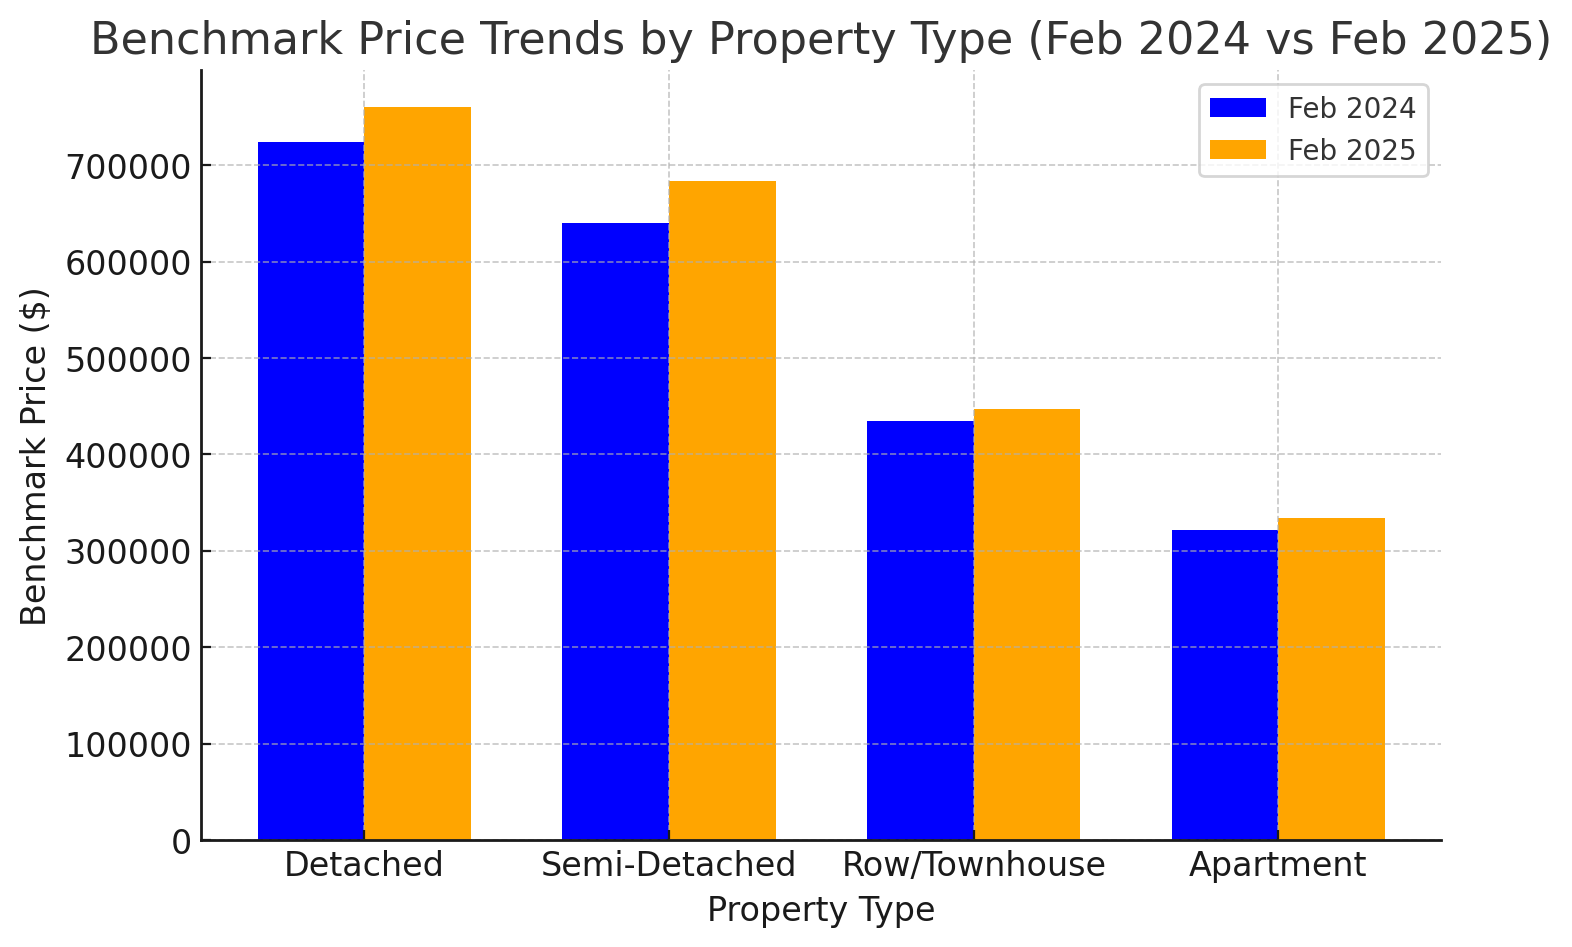
The unadjusted benchmark price for total residential properties in Calgary was $587,600 in February, reflecting a modest one per cent increase from the previous year. Price trends varied across different property types:
Detached Homes: The benchmark price rose to $760,500, a five per cent year-over-year increase. Notably, the City Centre district experienced the most significant growth, with prices climbing nearly eight per cent.
Semi-Detached Homes: Prices reached $683,500, up nearly seven per cent from February 2024. The City Centre and South districts led this growth, each recording approximately eight per cent increases.
Row/Townhouses: The benchmark price stood at $446,800, marking a three per cent rise year-over-year. The East district experienced a notable 12 per cent increase compared to 2024.
Apartment Condominiums: Prices averaged $334,200, reflecting a four per cent increase from the previous year. The West district saw the largest price growth in this segment, exceeding eight per cent.

Market Dynamics by Property Type
Detached Homes: Sales decreased by 20 per cent year-over-year to 765 units. New listings grew by six per cent, resulting in a 61 per cent increase in inventory levels to 1,698 units. Months of supply improved across all districts, with the City Centre and North East trending toward balanced conditions, while the South and North West remained supply-constrained at approximately 1.6 months.
Semi-Detached Homes: Sales declined by nearly 14 per cent to 165 units, while new listings rose by seven per cent to 240 units. This disparity led to a 46 per cent increase in inventory. Months of supply varied significantly across the city, from one month in the North West to eight months in the East district.
Row/Townhouses: Despite a nine per cent drop in sales to 318 units, new listings increased by almost four per cent. Inventory levels more than doubled to 655 units, though they remained below historical averages for February. The South and East districts had the tightest conditions, with under 1.5 months of supply, while the North East had nearly three months.
Apartment Condominiums: Sales fell by 26 per cent to 473 units but remained above long-term averages for February. New listings were relatively stable year-over-year at 852 units, the highest on record for the month. This led to a 90 per cent increase in inventory, pushing months of supply to 3.1 months—still below record levels observed between the 2014 oil crash and the pandemic.

Regional Market Highlights
Airdrie: Sales declined by nearly nine per cent to 123 units. New listings increased by nearly 23 per cent to 225 units, doubling inventory levels to 345 homes. The benchmark price was $537,600, 1.6 per cent higher than in February 2024.
Cochrane: Sales reached 75 units, with new listings at 126 units, both above long-term averages. Inventory rose by over 48 per cent year-over-year to 196 units. The benchmark price increased by over five per cent to $577,100.
Okotoks: Sales saw a four per cent year-over-year decline to 45 units. New listings increased by seven per cent compared to 2024, totaling 60 units. Inventory recovered to 69 units, 19 per cent above 2024. The benchmark price was relatively flat compared to January and under one per cent higher than in 2024.
Final Thoughts: A Market in Transition
February 2025 marked a noticeable shift in Calgary’s housing market dynamics. While sales remained above long-term trends, the increase in inventory and moderation in price growth indicate a cooling from the intense seller’s market of previous years. Detached and semi-detached homes continue to see price appreciation, while row and apartment-style properties are experiencing a more gradual upward trend.
For buyers, the growing inventory and easing market conditions may present opportunities, especially in segments where months of supply are increasing. For sellers, strategic pricing and well-prepared listings will be key to standing out in a more balanced environment.
As Calgary’s real estate landscape continues to evolve, staying informed is crucial for making well-timed decisions. Whether you're buying, selling, or simply watching the market, working with an experienced real estate professional ensures you navigate these changes with confidence.
Source CREB.com
Kristen Edmunds is a Calgary-area REALTOR® and Associate Broker with KIC Realty, specializing in acreages, luxury homes, and smart buy/sell strategies. With expertise in rural properties (water wells, septic, equestrian facilities) and a client-obsessed approach, Kristen helps buyers and sellers achieve their real estate goals with confidence and ease.

